Current State Employee Statistics
Tab/Accordion Items
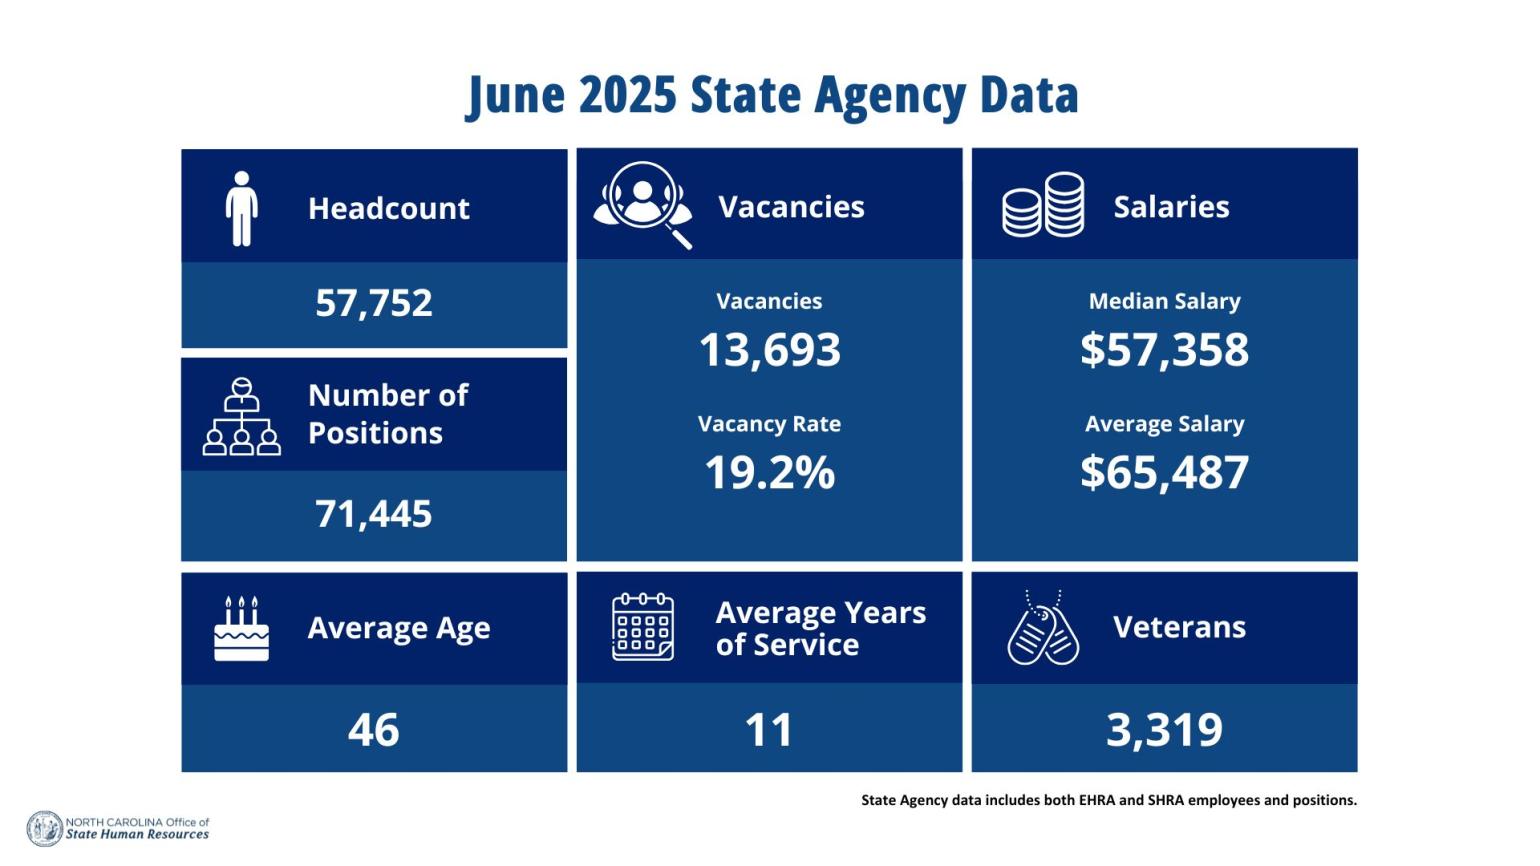
| Headcount | 57,752 |
|---|---|
| Number of Positions | 71,445 |
| Vacancies | 13,693 |
| Vacancy Rate | 19.2% |
| Median Salary | $57,358 |
| Average Salary | $65,487 |
| Average Age | 46 |
| Average Years of Service | 11 |
| Veterans | 3,319 |
State Agency data includes both EHRA and SHRA employees and positions.
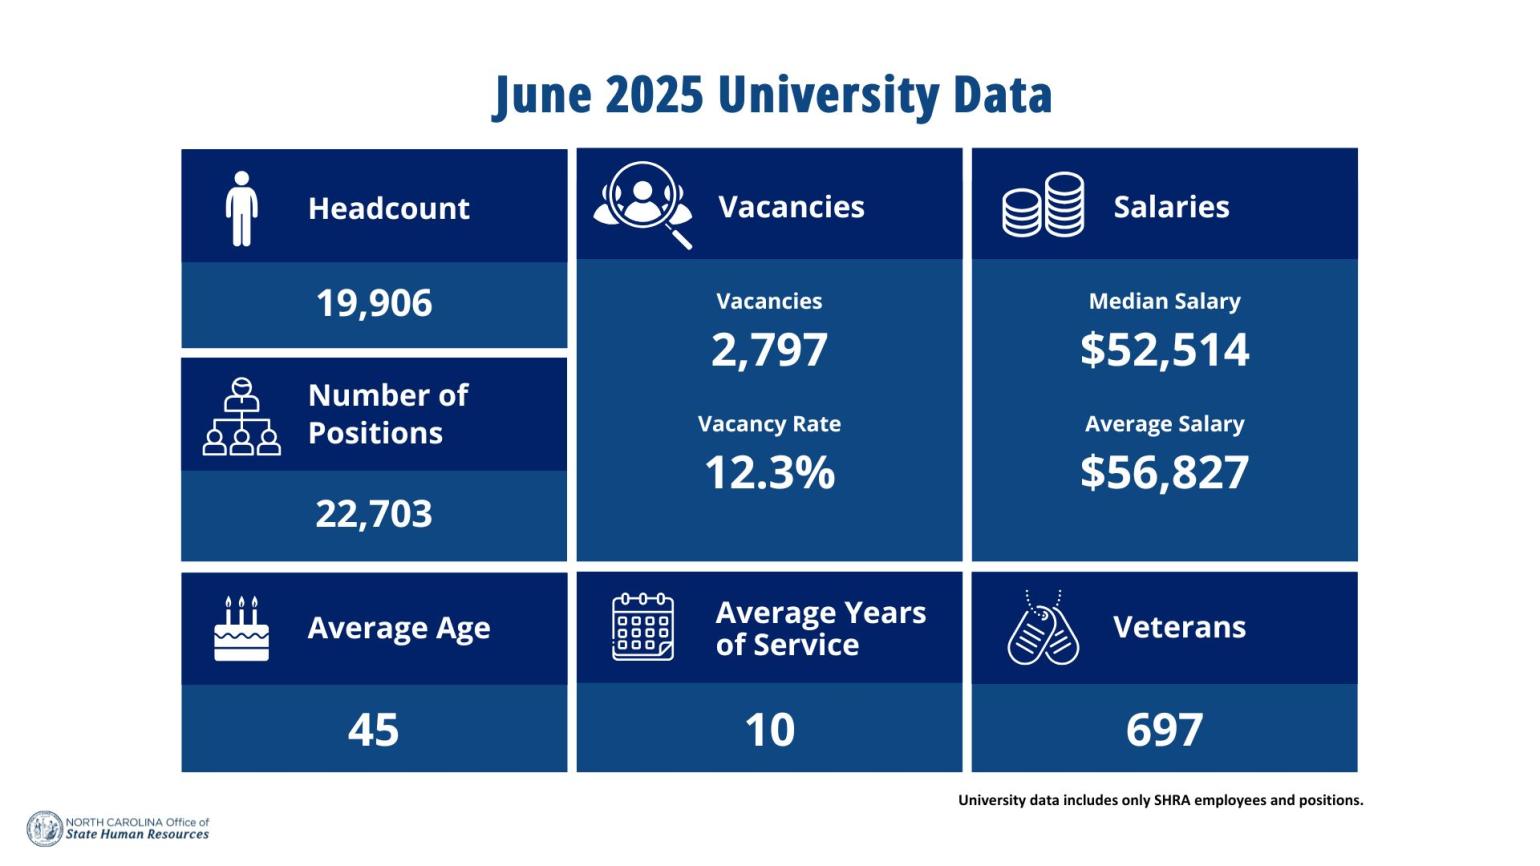
| Headcount | 19,906 |
|---|---|
| Number of Positions | 22,703 |
| Vacancies | 2,797 |
| Vacancy Rate | 12.3% |
| Median Salary | $52,514 |
| Average Salary | $56,827 |
| Average Age | 45 |
| Average Years of Service | 10 |
| Veterans | 697 |
University data includes only SHRA employees and positions.
As of June 2025
- Data Inclusion and Exclusion: This data set includes all State Agency SHRA and EHRA employees and positions, as well as all University SHRA employees and positions. It excludes the Judicial Branch, General Assembly, and School of Math & Science. Temporary employees, students, and contractors are also excluded. (For data on excluded categories, please contact those entities directly.)
- Subject to Human Resource Act (SHRA) employees refers to employees who are covered by the employment terms and conditions of the State Human Resources Act
| Age | Agencies | UNC | Total | Percent |
|---|---|---|---|---|
| <20 | 125 | 26 | 151 | 0.2% |
| 20-29 | 6463 | 3539 | 10,002 | 12.9% |
| 30-39 | 11904 | 4180 | 16,084 | 20.7% |
| 40-49 | 14349 | 4334 | 18,683 | 24.1% |
| 50-59 | 16499 | 4855 | 21,354 | 27.5% |
| 60-69 | 7639 | 2714 | 10,353 | 13.3% |
| 70+ | 773 | 258 | 1,031 | 1.3% |
| Grand Total | 57,752 | 19,906 | 77,658 | 100.0% |
| Agency Employment Type | Total | Percent |
|---|---|---|
| FT | 56,693 | 98% |
| PT | 242 | 0% |
| TL | 817 | 1% |
| Grand Total | 57,752 | 100% |
| Education | Agencies | UNC | Total | Percent |
|---|---|---|---|---|
| Advanced Degree | 8256 | 2171 | 10,427 | 13% |
| BAC DEG | 16683 | 5425 | 22,108 | 28% |
| ASSSOC DEG | 6368 | 1634 | 8,002 | 10% |
| Certifications/Other | 454 | 454 | 1% | |
| HS GRAD | 23930 | 2236 | 26,166 | 34% |
| LESS HS | 424 | 3411 | 3,835 | 5% |
| NO DATA | 1637 | 5029 | 6,666 | 9% |
| Grand Total | 57,752 | 19,906 | 77,658 | 100% |
| Gender | Agencies | UNC | Total | Percent |
|---|---|---|---|---|
| Female | 29369 | 11730 | 41,099 | 53% |
| Male | 28380 | 8175 | 36,555 | 47% |
| Unreported | 3 | 1 | 4 | 0.01% |
| Grand Total | 57,752 | 19,906 | 77,658 | 100% |
| Job Categories | Total | Percent |
|---|---|---|
| ADMINISTRATIVE SUPPORT | 5119 | 9% |
| AGRICULTURAL, ENVIRONMENTAL & SCIENTIFIC | 2283 | 4% |
| CORRECTIONS | 11677 | 20% |
| EDUCATION AND TRAINING | 1047 | 2% |
| ENGINEERING | 2923 | 5% |
| EXECUTIVE | 242 | 0% |
| FINANCIAL AND BUSINESS MANAGEMENT | 3247 | 6% |
| HUMAN RESOURCES | 770 | 1% |
| HUMAN SERVICES | 3254 | 6% |
| INFORMATION COMMUNICATION AND MEDIA | 449 | 1% |
| INFORMATION TECHNOLOGY | 2618 | 5% |
| INSTITUTIONAL SUPPORT SERVICES | 1162 | 2% |
| LAW ENFORCEMENT AND PUBLIC SAFETY | 3327 | 6% |
| LEGAL | 645 | 1% |
| MEDICAL AND HEALTH | 6435 | 11% |
| NATURAL,HISTORIC AND CULTURAL RESOURCES | 704 | 1% |
| OPERATIONS AND TRADES | 6352 | 11% |
| PLANNING AND ECONOMIC DEVELOPMENT | 364 | 1% |
| PROGRAM MANAGEMENT | 4174 | 7% |
| SAFETY AND INSPECTION | 960 | 2% |
| Grand Total | 57,752 | 100% |
| Ethnicity | Agencies | UNC | Total | Percent |
|---|---|---|---|---|
| African American | 18438 | 4821 | 23,259 | 30.0% |
| Asian | 1383 | 838 | 2,221 | 2.9% |
| Hispanic | 1578 | 1354 | 2,932 | 3.8% |
| Multinational | 700 | 419 | 1,119 | 1.4% |
| Native American | 861 | 323 | 1,184 | 1.5% |
| Pacific Islander | 44 | 14 | 58 | 0.1% |
| White | 34395 | 11526 | 45,921 | 59.1% |
| Ethnicity Not Given | 353 | 611 | 964 | 1.2% |
| Grand Total | 57,752 | 19,906 | 77,658 | 100.0% |
| Years of Service | Agencies | UNC | Total | Percent |
|---|---|---|---|---|
| 0 - 1 | 8066 | 2944 | 11,010 | 14% |
| 2 - 4 | 9798 | 4741 | 14,539 | 19% |
| 5 - 9 | 11931 | 3977 | 15,908 | 20% |
| 10 - 14 | 8139 | 2607 | 10,746 | 14% |
| 15 - 19 | 7326 | 2280 | 9,606 | 12% |
| 20 - 29 | 10484 | 2793 | 13,277 | 17% |
| 30+ | 2008 | 564 | 2,572 | 3% |
| Grand Total | 57,752 | 19,906 | 77,658 | 100% |
| Employees by Agency | Total | Percent |
|---|---|---|
| ADMINISTRATION | 461 | 0.8% |
| ADMINISTRATIVE HEARINGS | 50 | 0.1% |
| ADULT CORRECTION | 14440 | 25.0% |
| AGRICULTURE CONSUMER SERVICES | 1757 | 3.0% |
| AUCTIONEER LICENSING | 2 | 0.0% |
| BARBER & ELECTROLYSIS EXAMINER | 5 | 0.0% |
| COMMERCE | 1290 | 2.2% |
| COMMUNITY COLLEGES | 225 | 0.4% |
| COSMETIC ARTS | 26 | 0.0% |
| ELECTIONS & ETHICS | 73 | 0.1% |
| ENVIRONMENTAL QUALITY | 1655 | 2.9% |
| GOVERNOR'S OFFICE | 80 | 0.1% |
| HEALTH HUMAN SERVICES | 13793 | 23.9% |
| INFORMATION TECHNOLOGY | 1234 | 2.1% |
| INSURANCE | 585 | 1.0% |
| JUSTICE | 764 | 1.3% |
| LABOR | 350 | 0.6% |
| LT GOVERNOR'S OFFICE | 9 | 0.0% |
| MILITARY AND VETERANS AFFAIRS | 117 | 0.2% |
| NATURAL AND CULTURAL RESOURCES | 1956 | 3.4% |
| OPTICIANS | 1 | 0.0% |
| PSYCHOLOGY | 6 | 0.0% |
| PUBLIC INSTRUCTION | 1023 | 1.8% |
| PUBLIC SAFETY | 4740 | 8.2% |
| REVENUE | 1363 | 2.4% |
| SECRETARY OF STATE | 177 | 0.3% |
| STATE AUDITOR | 146 | 0.3% |
| STATE BUDGET & MANAGEMENT | 91 | 0.2% |
| STATE BUREAU OF INVESTIGATION | 424 | 0.7% |
| STATE CONTROLLER | 193 | 0.3% |
| STATE HUMAN RESOURCES | 99 | 0.2% |
| STATE TREASURER | 432 | 0.7% |
| TRANSPORTATION | 9537 | 16.5% |
| WILDLIFE RESOURCES COMMISSION | 648 | 1.1% |
| Grand Total | 57752 | 100% |
| Universities | Total | Percent |
|---|---|---|
| ASU | 1249 | 6.3% |
| ECSU | 122 | 0.6% |
| ECU | 1867 | 9.4% |
| FSU | 343 | 1.7% |
| NCA&T | 738 | 3.7% |
| NCCU | 418 | 2.1% |
| NCSSM | 96 | 0.5% |
| NCSU | 3605 | 18.1% |
| UNCA | 218 | 1.1% |
| UNCC | 1517 | 7.6% |
| UNC-CH | 6219 | 31.2% |
| UNCG | 884 | 4.4% |
| UNCP | 336 | 1.7% |
| UNCSA | 197 | 1.0% |
| UNC-System-Office | 164 | 0.8% |
| UNCW | 984 | 4.9% |
| WCU | 698 | 3.5% |
| WSSU | 251 | 1.3% |
| Grand Total | 19,906 | 100.0% |
| Counties | Agencies | UNC | Total | Percent |
|---|---|---|---|---|
| ALAMANCE | 214 | 2 | 216 | 0.3% |
| ALEXANDER | 444 | - | 444 | 0.6% |
| ALLEGHANY | 35 | - | 35 | 0.0% |
| ANSON | 499 | - | 499 | 0.6% |
| ASHE | 95 | - | 95 | 0.1% |
| AVERY | 349 | - | 349 | 0.4% |
| BEAUFORT | 248 | - | 248 | 0.3% |
| BERTIE | 258 | - | 258 | 0.3% |
| BLADEN | 267 | - | 267 | 0.3% |
| BRUNSWICK | 191 | - | 191 | 0.2% |
| BUNCOMBE | 1461 | 265 | 1726 | 2.2% |
| BURKE | 2568 | 27 | 2595 | 3.3% |
| CABARRUS | 388 | 41 | 429 | 0.6% |
| CALDWELL | 241 | - | 241 | 0.3% |
| CAMDEN | 27 | - | 27 | 0.0% |
| CARTERET | 510 | 4 | 514 | 0.7% |
| CASWELL | 276 | - | 276 | 0.4% |
| CATAWBA | 407 | - | 407 | 0.5% |
| CHATHAM | 233 | 40 | 273 | 0.4% |
| CHEROKEE | 101 | - | 101 | 0.1% |
| CHOWAN | 99 | - | 99 | 0.1% |
| CLAY | 23 | - | 23 | 0.0% |
| CLEVELAND | 284 | - | 284 | 0.4% |
| COLUMBUS | 818 | - | 818 | 1.1% |
| CRAVEN | 708 | - | 708 | 0.9% |
| CUMBERLAND | 756 | 308 | 1064 | 1.4% |
| CURRITUCK | 72 | - | 72 | 0.1% |
| DARE | 382 | - | 382 | 0.5% |
| DAVIDSON | 299 | - | 299 | 0.4% |
| DAVIE | 58 | - | 58 | 0.1% |
| DUPLIN | 121 | - | 121 | 0.2% |
| DURHAM | 799 | 486 | 1285 | 1.7% |
| EDGECOMBE | 167 | - | 167 | 0.2% |
| FORSYTH | 705 | 448 | 1153 | 1.5% |
| FRANKLIN | 209 | - | 209 | 0.3% |
| GASTON | 269 | - | 269 | 0.3% |
| GATES | 32 | - | 32 | 0.0% |
| GRAHAM | 21 | - | 21 | 0.0% |
| GRANVILLE | 2926 | - | 2926 | 3.8% |
| GREENE | 957 | - | 957 | 1.2% |
| GUILFORD | 829 | 1622 | 2451 | 3.2% |
| HALIFAX | 373 | 1 | 374 | 0.5% |
| HARNETT | 339 | 5 | 344 | 0.4% |
| HAYWOOD | 167 | - | 167 | 0.2% |
| HENDERSON | 220 | 12 | 232 | 0.3% |
| HERTFORD | 121 | - | 121 | 0.2% |
| HOKE | 96 | 7 | 103 | 0.1% |
| HYDE | 170 | - | 170 | 0.2% |
| IREDELL | 337 | - | 337 | 0.4% |
| JACKSON | 291 | 657 | 948 | 1.2% |
| JOHNSTON | 421 | 11 | 432 | 0.6% |
| JONES | 21 | - | 21 | 0.0% |
| LEE | 181 | - | 181 | 0.2% |
| LENOIR | 1393 | 5 | 1398 | 1.8% |
| LINCOLN | 167 | - | 167 | 0.2% |
| MACON | 67 | - | 67 | 0.1% |
| MADISON | 72 | 1 | 73 | 0.1% |
| MARTIN | 187 | - | 187 | 0.2% |
| MCDOWELL | 456 | - | 456 | 0.6% |
| MECKLENBURG | 812 | 1520 | 2332 | 3.0% |
| MITCHELL | 48 | - | 48 | 0.1% |
| MONTGOMERY | 241 | - | 241 | 0.3% |
| MOORE | 335 | 10 | 345 | 0.4% |
| NASH | 961 | 1 | 962 | 1.2% |
| NEW HANOVER | 973 | 986 | 1959 | 2.5% |
| NORTHAMPTON | 60 | - | 60 | 0.1% |
| ONSLOW | 216 | - | 216 | 0.3% |
| ORANGE | 178 | 6230 | 6408 | 8.3% |
| PAMLICO | 174 | - | 174 | 0.2% |
| PASQUOTANK | 379 | 122 | 501 | 0.6% |
| PENDER | 266 | 1 | 267 | 0.3% |
| PERQUIMANS | 82 | - | 82 | 0.1% |
| PERSON | 63 | 1 | 64 | 0.1% |
| PITT | 730 | 1869 | 2599 | 3.3% |
| POLK | 36 | - | 36 | 0.0% |
| RANDOLPH | 620 | - | 620 | 0.8% |
| RICHMOND | 342 | 2 | 344 | 0.4% |
| ROBESON | 545 | 345 | 890 | 1.1% |
| ROCKINGHAM | 234 | 6 | 240 | 0.3% |
| ROWAN | 554 | - | 554 | 0.7% |
| RUTHERFORD | 193 | - | 193 | 0.2% |
| SAMPSON | 391 | 4 | 395 | 0.5% |
| SCOTLAND | 539 | - | 539 | 0.7% |
| STANLY | 488 | - | 488 | 0.6% |
| STOKES | 93 | - | 93 | 0.1% |
| SURRY | 193 | - | 193 | 0.2% |
| SWAIN | 34 | - | 34 | 0.0% |
| TRANSYLVANIA | 62 | - | 62 | 0.1% |
| TYRRELL | 108 | 5 | 113 | 0.1% |
| UNION | 229 | 1 | 230 | 0.3% |
| VANCE | 119 | - | 119 | 0.2% |
| WAKE | 19499 | 3610 | 23109 | 29.8% |
| WARREN | 227 | - | 227 | 0.3% |
| WASHINGTON | 77 | 1 | 78 | 0.1% |
| WATAUGA | 126 | 1249 | 1375 | 1.8% |
| WAYNE | 1939 | 1 | 1940 | 2.5% |
| WILKES | 362 | - | 362 | 0.5% |
| WILSON | 662 | - | 662 | 0.9% |
| YADKIN | 68 | - | 68 | 0.1% |
| YANCEY | 59 | - | 59 | 0.1% |
| Grand Total | 57742 | 19,906 | 77648 | 100.0% |
On This Page Jump Links
Off